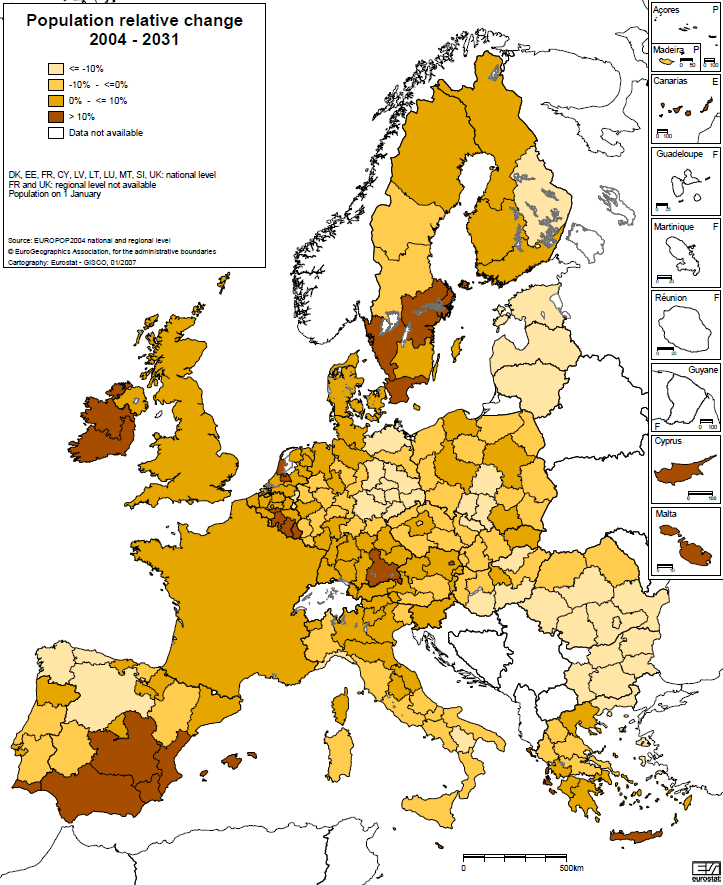
Figure 3: Map showing expected relative population change in the EU from 2004 – 2031. Note the
gaps in data and also the varying spatial scales of resolution, especially in the UK and France
compared with other countries (Source: GISCO, 2009).
Simon Bell and Susana Alves and Eva Silveirinha de Oliveira and Affonso Zuin, "Migration and Land Use Change in Europe: A Review",
Living Rev. Landscape Res., 4 (2010), 2, doi:10.12942/lrlr-2010-2, URL (accessed <date>): http://lrlr.landscapeonline.de/lrlr-2010-2. This work is licensed under a Creative Commons License.
© The author(s), except where otherwise noted.
This work is licensed under a Creative Commons License.
© The author(s), except where otherwise noted.
Living Rev. Landscape Res., 4 (2010), 2, doi:10.12942/lrlr-2010-2, URL (accessed <date>): http://lrlr.landscapeonline.de/lrlr-2010-2.
This work is licensed under a Creative Commons License.
© The author(s), except where otherwise noted.