List of Figures
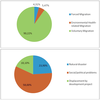 |
Figure 1:
Distribution of migrants by reasons. (Source: NSS, 2012) |
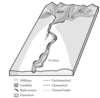 |
Figure 2:
Bank erosion in different sections of an idealised river network. Image reproduced with permission from Florsheim et al. (2008), copyright by OUP. |
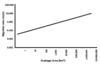 |
Figure 3:
Relationship between river channel migration rate and drainage area of the Lower Mississippi River. Image adapted from Hudson and Kesel (2000). |
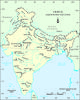 |
Figure 4:
Rivers in India. (Source:  http://nroer.in/gstudio/resources/imagecollection/colln/35270/) http://nroer.in/gstudio/resources/imagecollection/colln/35270/) |
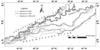 |
Figure 5:
Erosion and fill-ups of Brahmaputra River form 1966 to 2008. Image reproduced with permission from Dutta et al. (2010). |
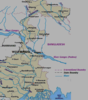 |
Figure 6:
Course of river Ganga (Ganges) in West Bengal. |
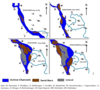 |
Figure 7:
Channel configuration of River Ganges during the period 1776 to 2010 (all figures are not to scale). Image adapted from Sinha and Ghosh (2012). |
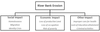 |
Figure 8:
Impact of river bank erosion |
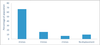 |
Figure 9:
Frequency of displacement of population in Methidanga village. (Source: Chatterjee and Mistri, 2013) |
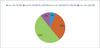 |
Figure 10:
Percentage of population suffering loss. (Source: Chatterjee and Mistri, 2013) |
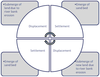 |
Figure 11:
Continuous process of forced migration. |
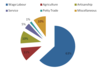 |
Figure 12:
Distribution according to primary occupation. (Source: DHDR, 2007) |
Tuhin K. Das and Sushil K. Haldar and Ivy Das Gupta and Sayanti Sen, "River Bank Erosion Induced Human Displacement and Its
Consequences",
Living Rev. Landscape Res., 8 (2014), 3, doi:10.12942/lrlr-2014-3, URL (accessed <date>): http://lrlr.landscapeonline.de/lrlr-2014-3. This work is licensed under a Creative Commons License.
© The author(s), except where otherwise noted.
This work is licensed under a Creative Commons License.
© The author(s), except where otherwise noted.
Living Rev. Landscape Res., 8 (2014), 3, doi:10.12942/lrlr-2014-3, URL (accessed <date>): http://lrlr.landscapeonline.de/lrlr-2014-3.
This work is licensed under a Creative Commons License.
© The author(s), except where otherwise noted.