List of Figures
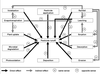 |
Figure 1:
Influence diagram of processes which affect pesticide loads to surface waters via runoff; +/- indicate influence in the same or opposite sense, respectively. |
Marcus Schulz and Michael Matthies, "Runoff of Pesticides:
Achievements and Limitations of Modelling Agrochemical Dislocation from Non-Point Sources at Various Landscape Related Scales",
Living Rev. Landscape Res., 1 (2007), 1, doi:10.12942/lrlr-2007-1, URL (accessed <date>): http://lrlr.landscapeonline.de/lrlr-2007-1. This work is licensed under a Creative Commons License.
© The author(s), except where otherwise noted.
This work is licensed under a Creative Commons License.
© The author(s), except where otherwise noted.
Achievements and Limitations of Modelling Agrochemical Dislocation from Non-Point Sources at Various Landscape Related Scales",
Living Rev. Landscape Res., 1 (2007), 1, doi:10.12942/lrlr-2007-1, URL (accessed <date>): http://lrlr.landscapeonline.de/lrlr-2007-1.
This work is licensed under a Creative Commons License.
© The author(s), except where otherwise noted.